AUDL Exploratory Data Analysis
A short exploration of year by year changes in meaningful AUDL statistics.
Introduction
The AUDL is a relatively young professional ultimate frisbee league that started in 2010. Because it seems like most sports develop a lot through their earliest years I wanted to explore if there were meaningful statistical differences between player performance across years of league play and if there are, what those differences are. In this post we will explore the data to try and find these differences. For more information on specifics of how the data is generated and thus, what conclusions we can make about it, see my previous post on AUDL Data generation. Keep in mind that although we may be able to spot trends in the data, this is just exploratory and no attempt to make a statistical model or provide inference is made.
Offensive Efficiency
One of the most important aspects of ultimate frisbee is offensive efficiency. In order for a team to be successful they must be efficient on offense. But how do we measure offensive efficiency? With the data I collected I was able to answer questions like:
- What is the overall year by year completion percentage?
- How many throwaways are made on average year over year?
- Is there any notable change between the relationship of assits and throwaways through the years?
Obviously there are many other questions to ask, but we will explore these in this post.
Year Over Year Completion Percentage
The graph below plots the distributions of completion percentage year over year:
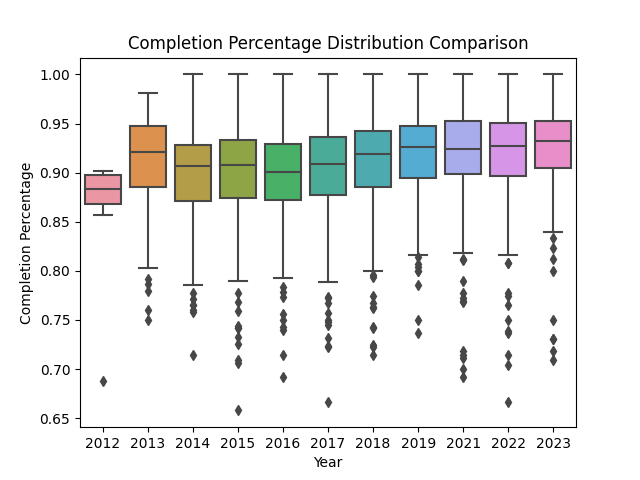
Although the trend doesn’t seem to be massive, there does seem to be an upward trend in completition percentage, with maybe even a smaller spread of the data, which could suggest an increase in offensive efficiency as the years go on.
Throwaways
The graph below plots the distributions of throwaways year over yea
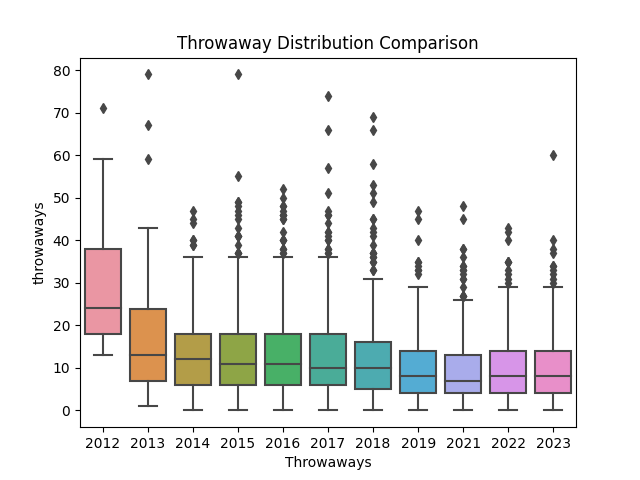
In this plot we can also see a general trend towards increased offensive efficiency (less throwaways is more efficient). Perhaps the greatest difference is in 2012 (we will explore more about this later).
Assists vs. Throwaways
The last plot exploring offensive efficiency compares season assist totals and season throwaway totals for each player based on year
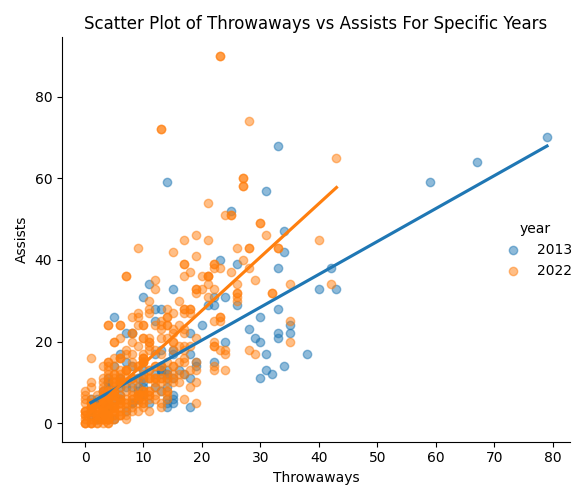
For simplicity’s sake I only include 2 years on this plot. The data is extremely dense (predictably so) near the origin, but as the assist numbers increase, it seems like in 2013, there are more throwaways compared to 2022. This could suggest more efficient offense in 2022 as well. It would make sense in general that players with higher assist totals have more turnovers just because they are high volume players. And interestingly, it seems like high volume players in 2022 are perhaps somewhat more efficient than high volume players in 2013.
Other Random Metrics
Because I was limited to the data collected via the AUDL API I just decided after exploring offensive efficiency to just explore random available stats. These include:
- Blocks
- Callahans
- Out of Bounds Pulls
- Stalls
Some questions that an understanding of these metric trends can answer:
- How have the number of blocks changed over the years? A change in block number can suggest tighter defense. Is that whats going on here?
- Has pulling gotten better over the years?
- A decrease in the number of stalls would coinside with the observation of higher offensive efficiency over the years. Is this the case?
Blocks
Below is a line plot plotting the trend in the total number of blocks recorded league wide year over year
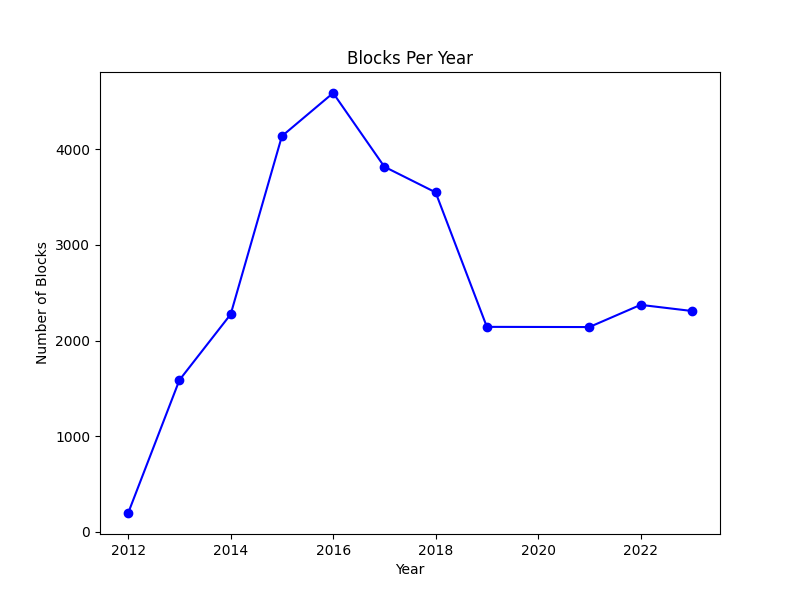
It’s interesting that these numbers spiked around 2016 and then went back down more recently. This may suggest some more volatile game play throughout those middle years (The block numbers seem unusually low for 2012 which may suggest some missing data as well).
Callahans
In frisbee, a callahan occurs when the defense catches a disc thrown by the offense in their own endzone, resulting immediately in a score. Although they are rare and I believe don’t can’t be read too much into the quality of a team or overall gameplay it’s an interesting metric to look at. Below is the total number of callahans recorded league wide year over year.
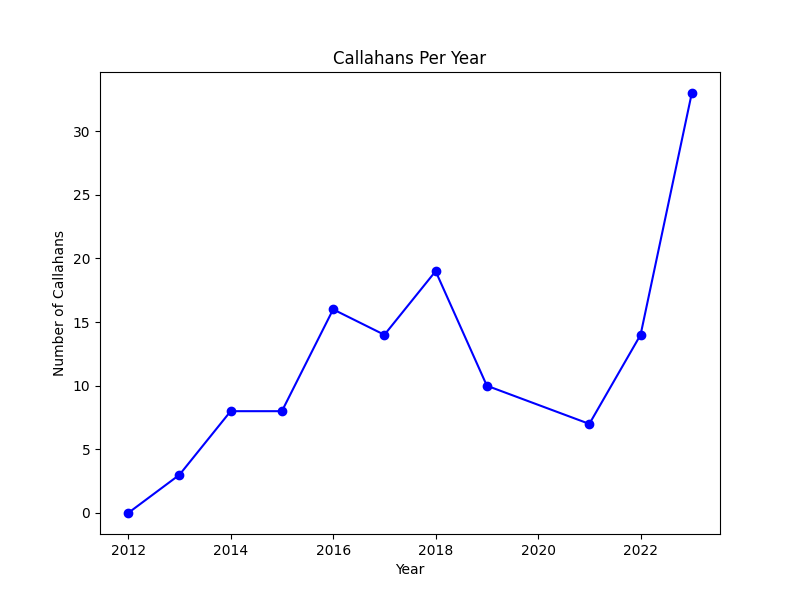
The spike in 2023 is pretty interesting. This can easily be explained by a rule change that was made after the 2022 season that allowed teams to pull further up the field which resulted in offenses getting pinned back in their own endzone more often and therefore throwing more callahans.
Out of Bounds Pulls
This one is mainly just for fun. It’s hard to really gain much insight into how league play is affected by how many out of bounds pulls happen each year, or why it even matters but heres the plot year over year:
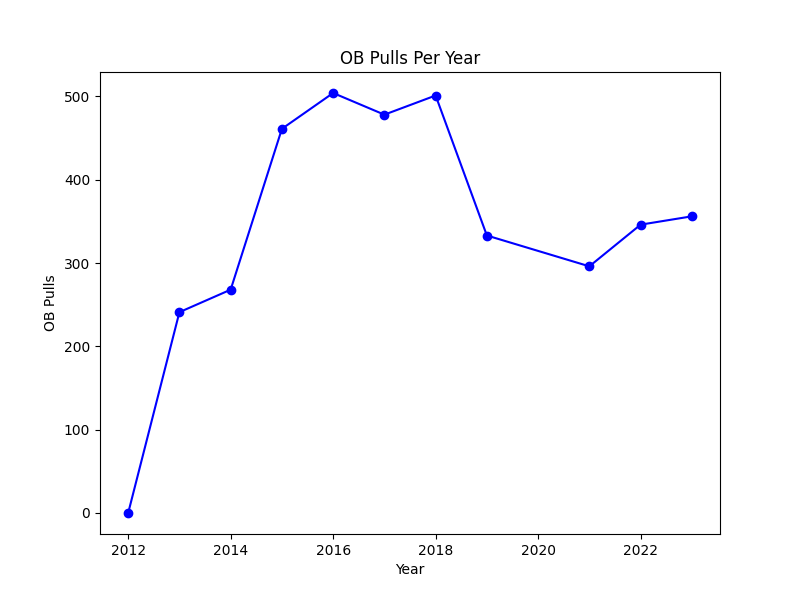
Again just like the Number of Blocks plot year over year, there is a spike around 2016 and then it goes back down. I’m not sure what kind of explanation can be derived from this but it is interesting that it follows the same general trend as Block Numbers.
Stalls
And last but not least, stalls. A stall is called in frisbee when the player holding the disc, holds onto it for too long. Here’s the year over year plot:
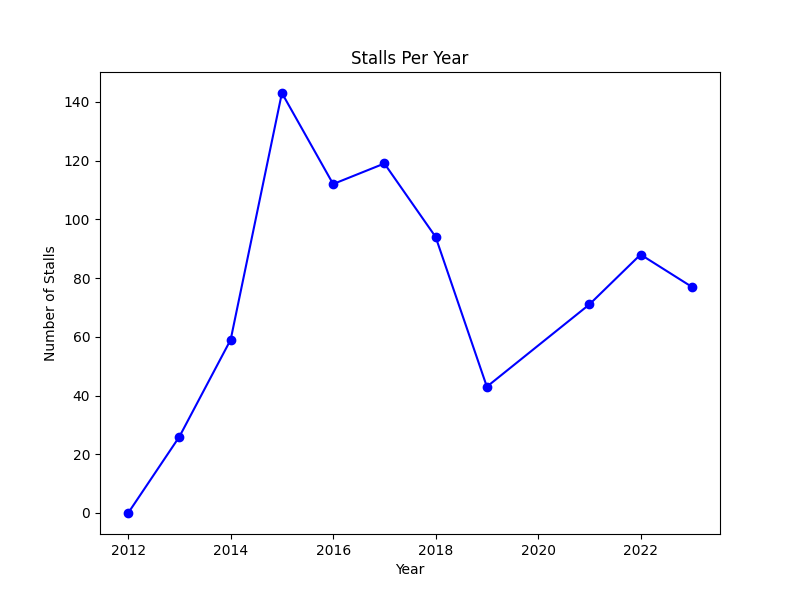
Again it looks like there are a lot of stalls called around 2016 and then there is smaller dip as we get to more recent seasons. I’m not sure what is going on here but it may relate directly to the data collection process. We can see through all 4 of the year over year comparisons that the metrics starts out very small, and then jump up, and come back down (besides in the case of Callahans, which explanation was already provided). This could be no more than an error in the data collection process I took. I think this is a more than reasonable explanation for the low numbers in 2012. There may, however be something else going on in the other years that lead to these interesting results.
Conclusion
It’s hard to make definite conclusions from the simple EDA conducted, but it looks to me like the overall offensive efficiency has increased over the years. This is what I would suspect as players are getting better and better and there is a growing sentiment in the league that offensive efficiency is key to winning championships. I would suspect in future years for players to get better and better offensively. The other metrics we looked at provided some interesting results. The upword trend in callahan numbers can be easily explained by a rule change but other metric trends are harder to interpret. Deeper analysis will have to be made to explain what’s going on there!
**To interact with these visualizations yourself visit my “AUDL Yearly Metric Analysis” streamlit app here. Also to see the code used in this blog post visit my GitHub repository here.